


Sep 12, 2017 12:21 pm +08:00
Talking Points:
- Gold prices may continue to fall as UK, US inflation numbers rise
- Crude oil prices look to OPEC, EIA and API reports for direction
- What do retail traders’ bets say about gold trends? Find out here
Gold prices plunged as a market-wide
recovery in risk appetite sent capital flows pouring out of the safety
of Treasury bonds, pushing yields upward alongside shares. The chipper
mood likewise echoed in Fed rate hike expectations, with the priced-in
2017 policy path steepening and sending the US Dollar upward. Not surprisingly, this undermined the appeal of non-interest-bearing and anti-fiat assets.
Looking ahead, UK CPI data
is expected to see the headline on-year inflation rate rising to 2.8
percent in August, a hair below the four-year high of 2.9 percent set in
May. While markets are not expecting the BOE to raise rates this year,
prospects for tightening in 2018 have firmed recently. Firm price growth
data that reinforces this dynamic may boost global tightening bets,
hurting the yellow metal.
From there, US PPI enters
the picture. Median forecasts see factory-gate price growth posting the
first increase in four months to hit 2.5 percent, the highest since
April. An outcome echoing broad improvement in US news-flow over the
past three months may give Fed tightening prospects another upward nudge
– a dire prospect for precious metals – although follow-through may
wait for CPI data due Thursday.
Crude oil prices paused to consolidate
losses after suffering the largest drop in three months on Friday.
Separate monthly outlook reports from the EIA and OPEC are due in the hours ahead while API
will release weekly inventory flow statistics. Taken together, these
will inform prospects for working down a global supply glut, an effort
led by the cartel’s production cut scheme and offset by US output.
GOLD TECHNICAL ANALYSIS – Gold
prices proved unable to sustain the ascent to 13-month highs as
suspected, turning sharply lower to post the largest drop since early
July. From here, a daily close below the 1312.62-21.51 area (23.6%
Fibonacci retracement, trend line) exposes the 1295.46-99.25 zone (38.2%
level, double top). Alternatively, a reversal back above the 14.6% Fib
at 1335.24 opens the door for a retest of the September 8 high at
1357.50.

Chart created using TradingView
CRUDE OIL TECHNICAL ANALYSIS – Crude
oil prices are digesting losses after recoiling from trend line
resistance guiding them lower since February. A move below support at
47.54, the 38.2% Fibonacci expansion, exposes the 50% level at 46.98
anew. Alternatively, a push back above the 23.6% Fib at 48.25 paves the
way for another challenge of 49.39 (September 6 high, trend line).
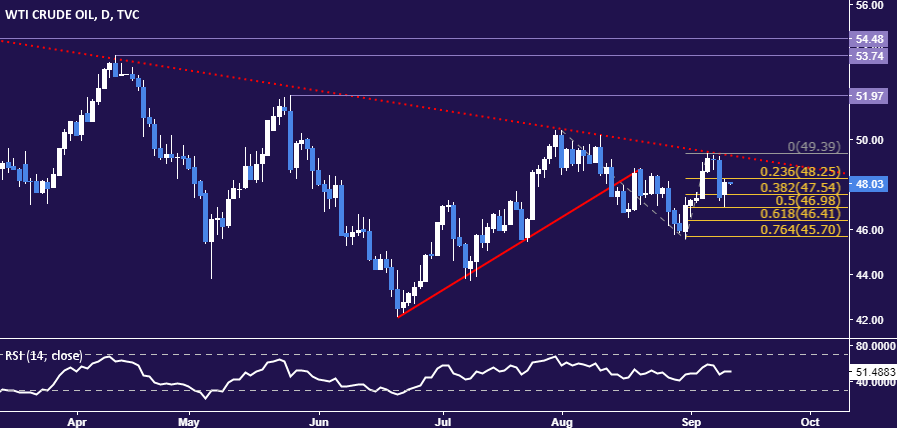
Chart created using TradingView
Ref:https://www.dailyfx.com/forex/fundamental/daily_briefing/daily_pieces/commodities/2017/09/12/Gold-Prices-May-Continue-to-Fall-After-Largest-Drop-in-2-Months.html?DFXfeeds=forex:fundamental:daily_briefing:daily_pieces:commodities
No comments:
Post a Comment